Hello Class,
For Assignment 4, I began by entering the data into Excel and saving as a csv file.
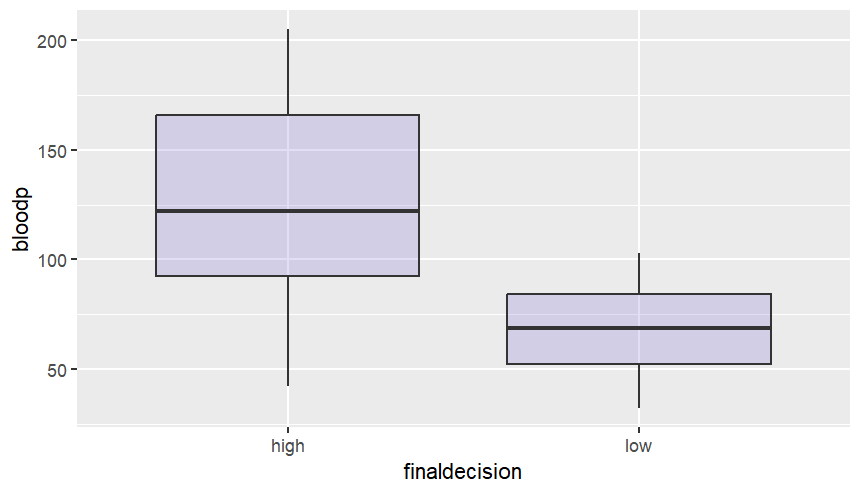
I then created a boxplot of the data comparing the Blood pressure of individuals given high or low final decisions (see plot below). I used the ggplot package to do this
After that I created a histogram of Blood Pressures using the ggplot package (see plot below).
Finally I calculated the mean BP by the final decision with the following result:
  Group.1        x
1    high 125.6667
2     low  68.0000
My script may be found at: https://github.com/Wellis11/assignment4final


No comments:
Post a Comment