Tuesday, March 21, 2023

Assignment 10

 Today I began the creation of my R Package called Rforestry.  It will be a useful way to convert individual measurements of trees in the field to a summary measure of tree density and basal area.  The package will be housed on GitHub in the following repository:

https://github.com/Wellis11/Rforestry

I am having trouble understanding how to link this package directly to GitHub for backup so I manually uploaded the Description file for the class to view.

Here is the Description file that I have associated with this package:

Package: Rforestry
Type: Package
Title: Calculate Forestry Measures
Version: 0.1.0
Author: William Ellis
Maintainer: wellis@usf.edu
Description: This package when given tree diameter and distances
from randomly placed centerpoints calculates forest density and
basal area.
License: CC0
LazyData: true

Monday, February 20, 2023

Assignment 6

 Assignment 6

The code for this assignment may be accessed at https://github.com/Wellis11/assignment6.

1. Consider A=matrix(c(2,0,1,3), ncol=2) and B=matrix(c(5,2,4,-1), ncol=2).
a) Find A + B

For this part of the assignment I just created the matrices as objects and added them together.  This worked because the matrices had the same dimensions.

     [,1] [,2]
[1,]    7    5
[2,]    2    2

b) Find A - B

For this part of the assignment I just created the matrices as objects and subtracted B from A.  This worked because the matrices had the same dimensions.

     [,1] [,2]
[1,]   -3   -3
[2,]   -2    4

2. Using the diag() function to build a matrix of size 4 with the following values in the diagonal 4,1,2,3.

For this part of the assignment, I used the code:

m=c(4,1,2,3) #create vector with specified values

M=diag(m,4) #create matrix with vector values in diagonal

print(M)

which gave this output:

     [,1] [,2] [,3] [,4]
[1,]    4    0    0    0
[2,]    0    1    0    0
[3,]    0    0    2    0
[4,]    0    0    0    3

3. Generate the following matrix:

I did this last part in three sections.  I created 5x5 matix with 3 as the diagonal.  I then created 2 separate 5x5 matrices with the numbers needed to contribute to the final product via addition.  Here is the code and the output:

N=(diag(5))*3

O=matrix(c(0,0,0,0,0,1,0,0,0,0,1,0,0,0,0,1,0,0,0,0,1,0,0,0,0), ncol=5)

P=matrix(c(0,2,2,2,2,0,0,0,0,0,0,0,0,0,0,0,0,0,0,0,0,0,0,0,0), ncol=5)

Q=N+O+P

print(Q)

     [,1] [,2] [,3] [,4] [,5]
[1,]    3    1    1    1    1
[2,]    2    3    0    0    0
[3,]    2    0    3    0    0
[4,]    2    0    0    3    0
[5,]    2    0    0    0    3

Monday, February 6, 2023

Assignment 4

 Hello Class,

For Assignment 4, I began by entering the data into Excel and saving as a csv file.

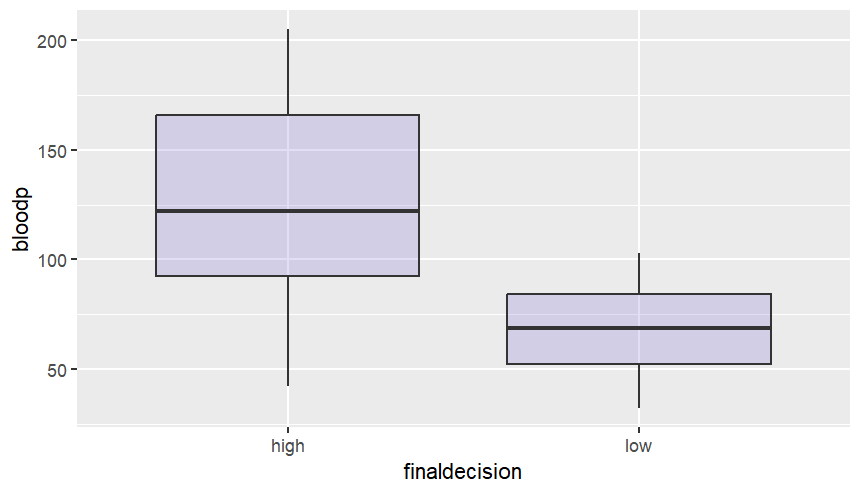
I then created a boxplot of the data comparing the Blood pressure of individuals given high or low final decisions (see plot below).  I used the ggplot package to do this

After that I created a histogram of Blood Pressures using the ggplot package (see plot below).

Finally I calculated the mean BP by the final decision with the following result: 

  Group.1        x
1    high 125.6667
2     low  68.0000

My script may be found at: https://github.com/Wellis11/assignment4final


Monday, January 30, 2023

 Hello Class,

In this assignment we were to calculate the mean of two polls for several candidates.  To do this (you may find my code here: https://github.com/Wellis11/assignment3 , I combined two concatenated lists of poll values into a data frame.  I then found the mean of each row of values (ABC and NBC polls).  I wanted to organize this by candidate, so I combined this new list of means with the list of candidate names into a new data frame.

I imagine there is a more efficient way of doing this.  I would liked to have found a way to create just a single data frame and calculate the mean of numerical components of rows and present the results headed by the candidate names.

Below is my code and output.

>Name = c("Jeb", "Donald", "Ted", "Marco", "Carly", "Hillary", "Bernie")

>ABC_political = c(4, 62, 51, 21, 2, 14, 15)

>NBC_political = c(12, 75, 43, 19, 1, 21, 19)

>first.df = data.frame(ABC_political, NBC_political)

>first.df

>pollmean=(rowMeans(first.df))

>pollmean

>second.df = data.frame(Name, pollmean)

>second.df


Monday, January 23, 2023

 In Assignment 2, we were presented with the prompt:

assignment2 <- c(161814222717191717222022)
>
myMean <- function(assignment2) { return(sum(assignment2)/length(assignment2)) }
> YOUR turn...


In analyzing this R code, after reading the article "Writing Functions Using R" it was apparent that the intended purpose of the function "myMean" was to return the mean value of the sequence "assignment2" by dividing the sum of the sequence by the length of the sequence.  As written, the code did nothing.  The expression was correctly formatted, but I needed to replace line 3 (>YOUR turn...) to get the code to return a value.  I chose to enter 

"> myMean(assignment2)" 

to apply the function to the object "assignment2".  When I did so, R returned [1] 19.25, which is the mean of the sequence.  It worked!


I am having a terrible time understanding how to link RStudio to GitHub.  I'm also uncertain if I should be using the Project window or the console window in RStudio to create and test my code.  It seems as though the project window is necessary for versioning.  If that is the case, why would I use the console window?  I'll figure this out eventually.


Saturday, January 14, 2023

 I have a new Git Hub repository:

R_Prog_Course_Wellis